Difference between revisions of "S16: Helios"
Proj user8 (talk | contribs) (→Calibration) |
Proj user8 (talk | contribs) (→Hardware Design) |
||
| Line 216: | Line 216: | ||
[[File:CMPE_244_S16_Helios_object.png|right|300px|thumb]] | [[File:CMPE_244_S16_Helios_object.png|right|300px|thumb]] | ||
IR detector module device has two potentiometers that can be used to calibrate the device. One for frequency (F) and one for distance (D). Much like an IR Remote, the IR light is oscillated at a defined frequency and detected at that same frequency; this enables the sensor to work in noisy environments. The frequency of the detector module can be adjusted to avoid interference with other detectors or other IR sources. Turning the frequency potentiometer clockwise increases the frequency and turning it anti clockwise decreases the frequency.The distance at which the sensor is triggered is determined by adjusting the Distance potentiometer. When the sensor is triggered the LED will light up. Turning this pot clockwise increases the triggering distance, turning it counter-clockwise decreases the distance. | IR detector module device has two potentiometers that can be used to calibrate the device. One for frequency (F) and one for distance (D). Much like an IR Remote, the IR light is oscillated at a defined frequency and detected at that same frequency; this enables the sensor to work in noisy environments. The frequency of the detector module can be adjusted to avoid interference with other detectors or other IR sources. Turning the frequency potentiometer clockwise increases the frequency and turning it anti clockwise decreases the frequency.The distance at which the sensor is triggered is determined by adjusting the Distance potentiometer. When the sensor is triggered the LED will light up. Turning this pot clockwise increases the triggering distance, turning it counter-clockwise decreases the distance. | ||
| + | |||
| + | |||
| + | |||
| + | |||
| + | |||
| + | |||
==== Servo Motor ==== | ==== Servo Motor ==== | ||
Revision as of 23:11, 20 May 2016
Contents
- 1 Grading Criteria
- 2 Automated Assembly Line
- 3 Abstract
- 4 Objectives & Introduction
- 5 Schedule
- 6 Parts List & Cost
- 7 System Block Diagram
- 8 Design & Implementation
- 9 Testing & Technical Challenges
- 10 Conclusion
- 11 References
Grading Criteria
- How well is Software & Hardware Design described?
- How well can this report be used to reproduce this project?
- Code Quality
- Overall Report Quality:
- Software Block Diagrams
- Hardware Block Diagrams
- Schematic Quality
- Quality of technical challenges and solutions adopted.
Automated Assembly Line
This project is an automated assembly line capable to defect detection, rejection and sorting with the help of wireless communication and image processing.
Abstract
The project is an automated assembly line capable of object defect detection, object rejection and sorting with the help of image processing algorithms and wireless communication. The entire system comprises of three micro controllers (2 SJOne boards and one Raspberry pi 2). A wired interface exists between raspberry pi 2 and SJOne transmitter board, while the two SJOne boards communicate via nordic wireless. Raspberry pi 2 is equipped with a linux operating system with Open CV support to run image processing algorithms for color and shape detection. All three micro controllers are mounted to a miniature assembly line with object moving on it. The SJOne transmitter board is capable of object rejection using servo motor and IR object detector module, while the SJOne receiver board is capable of simple sorting using servo motor based on the result of object color and shape detection algorithms running on raspberry pi 2.
Objectives & Introduction
- To design a automated assembly line with motor drive.
- To implement nordic wireless communication on SJOne board for communication of control signals.
- To design and implement color and shape detection algorithms using Open CV.
- To use servo motors with mechanical parts to perform object rejection and sorting.
- To be able to process images of objects on the belt and decide the acceptance of object for future processing on the assembly line.
There is a need for Assembly lines to incorporate intelligence to identify and reject defective products. Image processing is one of the foremost technologies responsible for achieving this intelligence. An assembly line with wireless and object detection, sorting capabilities is the prime goal of this project. The need for a wireless assembly line arises due to large wiring overhead in wired systems.
A camera captures the pictures of items that move on an Assembly line. The raspberry pi 2 board processes these pictures and assesses color and shape information and communicates to boards further down the aseembly line to take appropriate action. The SJOne transmitter board receives the information and rejects defective items from the assembly line while retaining fit items for the future stages of the assembly line. The SJOne receiver board uses servo motor to bifurcate the products into two separate belts based on color for future actions.
Team Members & Responsibilities
- OpenCV installation, Rasberry Pi environment setup, Hardware support
- Open CV installation support, Nordic wireless communication, Stepper and servo control, Conveyor and Hardware
Sindhuja Gopalakrishnan Elango
- Open CV algorithm design, Nordic wireless communication, Sensor implmentation, Hardware support
Akshay Dabholkar
- Open CV algorithm design,implementation and verification, Hardware support
Schedule
This section of the report provides the team schedule for the Assembly line project, indicating the milestones to be achieved during the course of the project.
| SI No. | Start Date | End Date | Task | Status | Actual Completion Date |
|---|---|---|---|---|---|
| 1 | 03/20/2016 | 03/29/2016 |
|
Completed | 03/29/2016 |
| 2 | 03/30/2016 | 04/05/2016 |
|
Completed | 04/05/2016 |
| 3 | 04/06/2016 | 04/12/2016 |
|
Completed | 04/12/2016 |
| 4 | 04/13/2016 | 04/19/2016 |
|
Completed | 04/25/2016 |
| 5 | 04/20/2016 | 04/26/2016 |
|
Completed | 05/05/2016 |
| 6 | 04/27/2016 | 05/03/2016 |
|
Completed | 05/12/2016 |
| 7 | 05/04/2016 | 05/10/2016 |
|
Incomplete | |
| 8 | 05/11/2016 | 05/17/2016 |
|
Incomplete |
Parts List & Cost
| Item# | Part Description | Vendor | Qty | Cost |
|---|---|---|---|---|
| 1 | Conveyer system | Amazon | 1 | $34.62 |
| 2 | IR Object detector | Fry's | 2 | $21.78 |
| 3 | Antenna - Wireless communication | Amazon | 2 | $10.9 |
| 4 | 5V Stepper Motor with driver break out board | Amazon | 2 | $11.98 |
| 5 | Microsoft USB HD camera | Amazon | 1 | $24.24 |
| 7 | Wire Cutter | Amazon | 1 | $2.99 |
| 8 | Hardware Items | Home Depot | 1 | $15.49 |
| Total Cost | $113.87 |
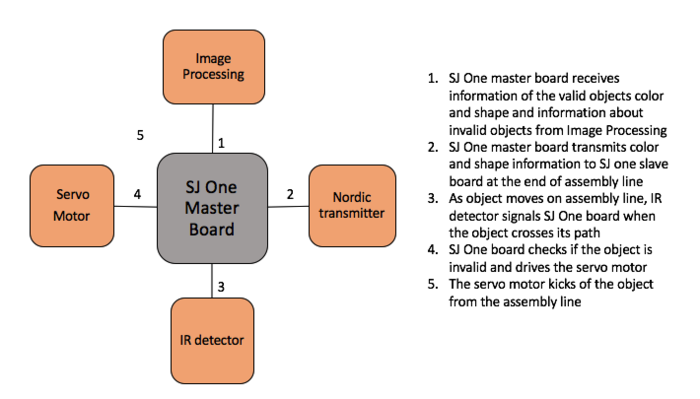
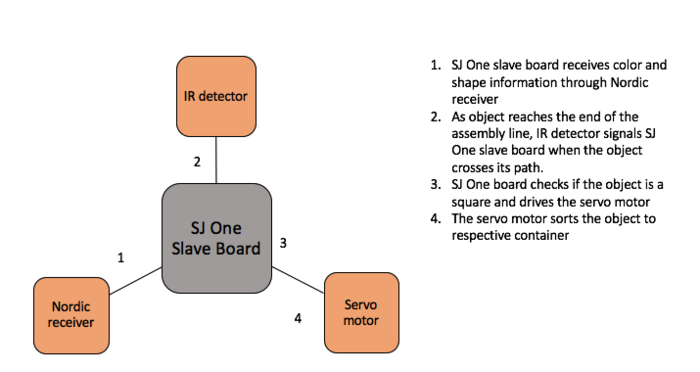
System Block Diagram
Design & Implementation
The design section can go over your hardware and software design. Organize this section using sub-sections that go over your design and implementation.
Hardware Design
Discuss your hardware design here. Show detailed schematics, and the interface here.
SJOne Board
Raspberry Pi
Conveyor Belt
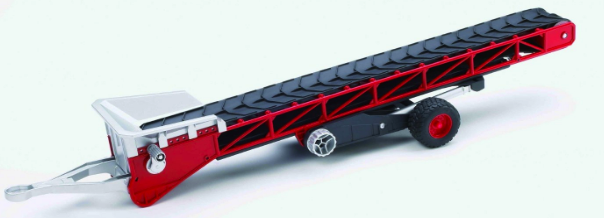
Conveyor belt is a mechanical system with which materials can be transferred from one location to another. Conveyor systems are used in many industrial applications for safely transferring materials where several processing steps happen on the material when it travels on the belt. As the conveyor system is fully automated, it can be ensured to a have a uniform throughput of the deliverable. Industries thus use the conveyors for increasing their production rate. Conveyor systems are very popular in material handling, packaging, automotive, food processing and many other industries.
Webcam
Nordic wireless
IR Detector
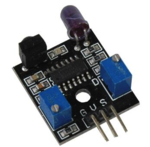
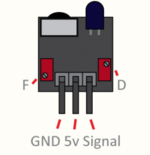
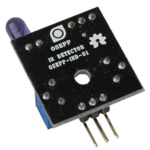
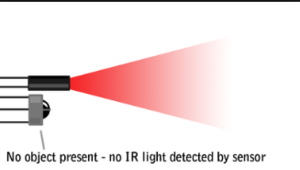
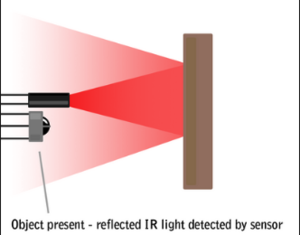
IR Detector OSEPP IRDET-01 detects obstacles when they are in the calibrated range. The module has 3 pins which are the ground(G), VCC(V) and Signal(S). The signal wire line is digital. It can be either high or low. High if the detected range is further than the calibrated distance, low if the detected range is less than the calibrated distance. The pins are connected to the GND, VCC and GPIO pin of the SJone board, The pin direction is set as input. When no object is detected the pin will read 0 and when object is detected the pin will read 1.
Calibration
IR detector module device has two potentiometers that can be used to calibrate the device. One for frequency (F) and one for distance (D). Much like an IR Remote, the IR light is oscillated at a defined frequency and detected at that same frequency; this enables the sensor to work in noisy environments. The frequency of the detector module can be adjusted to avoid interference with other detectors or other IR sources. Turning the frequency potentiometer clockwise increases the frequency and turning it anti clockwise decreases the frequency.The distance at which the sensor is triggered is determined by adjusting the Distance potentiometer. When the sensor is triggered the LED will light up. Turning this pot clockwise increases the triggering distance, turning it counter-clockwise decreases the distance.
Servo Motor
Stepper Motor
Hardware Interface
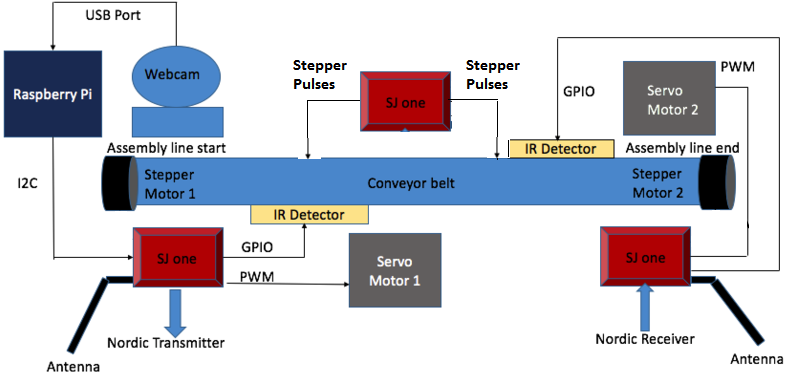
The hardware interface is divided into two parts. Components that were interfaced with SJOne Master board and components that were interfaced with the SJOne Slave board. Both the SJone boards had to be mounted one on each end of the conveyor system. Decsions made by the SJone master board will be implemented by the SJOne slave board.
Building our own conveyor system
Initially it was decided to buy or rent conveyor systems and interface components to it. First option was to buy the conveyor system. On enquiring with many dealers who supplied industrial mini conveyor systems to small scale and large scale industries , it turned out that a simple system was around 1200 US dollars. Second option was to rent the conveyor belt. Renting it for a day would cost around 200 dollars. But the requirement for the project was definitely more than a day. There were development and testing phases of each component that had to be mounted with the conveyor belt and tested frequently. So the options of buying and renting were eliminated. Having an objective of building an economical automated conveyor system, the decision to self build the conveyor system was made by the team.
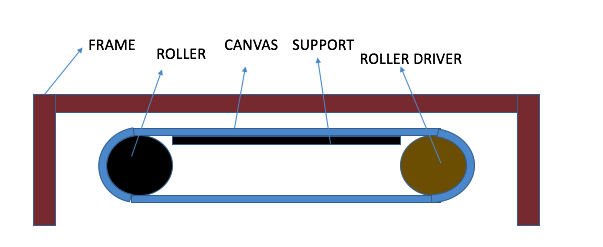
Nevertheless, it wasn't that easy to build a conveyor system. The conveyor system required the following
- A rigid frame on both sides to hold the conveyor belt
- Rotating cylinders that had to be mounted to either ends of the frame.
- A conveyor belt that could slide on the cylinders bordered by the rigid frame
Interface with SJOne Master Board
Interface with SJOne Slave Board
Software Design
Show your software design. For example, if you are designing an MP3 Player, show the tasks that you are using, and what they are doing at a high level. Do not show the details of the code. For example, do not show exact code, but you may show psuedocode and fragments of code. Keep in mind that you are showing DESIGN of your software, not the inner workings of it.
Assembly line Mechanism
Object Detection and Analysis with OpenCv and image processing
Image processing is the process of manipulating image data in order to make it suitable for computer vision applications. Computer vision helps to obtain relevant information from images and make decisions based on that information. In our project, we have used OpenCV with C++ to develop our computer vision application. OpenCV is an open source C++ library for image processing and computer vision, originally developed by Intel and now supported by Willow Garage. OpenCV has many inbuilt functions for image processing and computer vision that are mainly aimed at real-time processing.
Digital Image and pixels
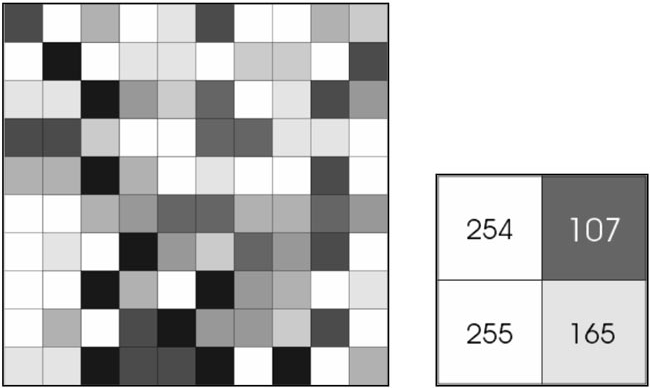
A digital image is a collection of pixels. A pixel is the smallest element in a digital image. In an image, each pixel can have a particular value to represent that image. For example, consider a grayscale image where each pixel can be represented by 8-bit value. So, each pixel can have a range of 0 to 255 where 0 is the complete black and 255 is a completely white pixel.
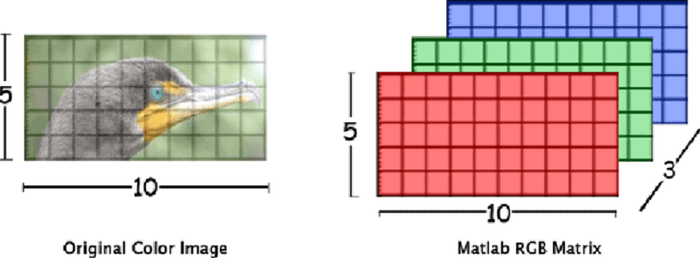
A color image consists of 3 planes Red, Green, and Blue. Any color can be formed with the combination these three planes. These planes are called channels of the image. So, an RGB i.e. a color image has 3 channels. Each pixel in RGB has a combination of three values. (255, 0, 0) represent pure red. (0, 255, 0) represent pure green. (255, 0, 255) represents pure violate. Thus, each pixel is represented by 24-bits in an RGB.
Color Detection
Object detection and segmentation is the most important task of computer vision. The easiest way to detect and segment the object is through color detection.
The method used for color detection was to first convert the RGB image into HSV and then by thresholding the HSV image, the binary version (Black and White) of the HSV can be obtained. In this binary image, the white space would represent the color which wants to detect. This binary image can then be used to detect the object we are looking using color detection and also to find the shape of the detected object using the available OpenCv library functions.
Need to convert from RGB to HSV
RGB color space describes colors in terms of the amount of red, green, and blue present. HSV color space describes colors in terms of the Hue, Saturation, and Value. The HSV image separates luma (intensity component), from chroma (color component). So that we can now perform histological equalization of the image by adjusting the minimum and maximum values of H, S, and V to such levels that only the pixel with the desired color will be illuminated (white) and the rest of the pixels will be dark.
void inRange(InputArray src, InputArray lowerb, InputArray upperb, OutputArray dst) library function was used to threshold the HSV image.
Src is the source image. Dst is the thresholded image. The upperb and lowerb boundary parameters are scalars (minimum and maximum values of HSV) which can be determined using trackbars.
Trackbars
Trackbar is a very useful tool which allows us to change various parameters while our OpenCv application is running. In our project, we made extensive use of trackbars to determine upper and lower boundary parameters for the particular color which we want to detect. Show the image of trackbars and thresholded image. As shown in the fig. we can change the minimum values of H, S, and V in such a manner that only the desired color will remain as a whitespace and rest of the image should be dark. Once the minimum and maximum values are determined we can lock down these values with inRange() function to get the thresholded image.
int createTrackbar(const string& trackbar name, const string& winname, int* value, int count, TrackbarCallback) is the library function which was used to create the trackbars.
Trackbarname is the name of the trackbar. Winname is the window name to which trackbar is attached. Integer, pointed by this pointer, holds the value associated with the position of the trackbar. count - The maximum value of the trackbar. The minimum value is always zero.
findContours library function
Using find contours we can retrieve the contours from the binary image that we obtained through thresholding the HSV image. void findContours(InputOutputArray image, OutputArrayOfArrays contours, OutputArray hierarchy, int mode, int method, Point offset=Point()) We can pass appropriate modes to retrieve the different contour information from the image. The contour information is retrieved in the contour is a vector of points. From the contours information, we can find the area of the whitespaces using moments method which is actually the target color and can detect the color.
Algorithm for Color Detection
Step1: Initialize the camera.
Step2: Capture the image frame.
Step3: Convert the image from RGB to HSV.
Step4: Threshold the image for the required color.
Step5: Apply morphological operations to eliminate noise.
Step6: Find contours of the binary image.
Step7: Find the number of whitespace regions using the contour information.
Step8: If no whitespaces found go to step 2, else proceed to step9.
Step9: Check if the area of whitespace is greater than the minimum area. If area is less than the minimum area set, it may be a noise then go to step 2, else proceed to step 10.
Step10: Set object found flag to true. Continue scanning go to step2.
Flowchart for Color Detection
Shape Detection
Once the color detection and segmentation is done, the shape detection of the detected object is a very simple task. We can use the same findContours library function but during this time to extract the vertices of the vertices of the segmented object. This can be easily done by passing the appropriate parameters to the findContours function. Once the vertices are determined as a vector of points, using the count of the vertices we can easily determine the shape of the segmented object.
Algorithm for Shape detection
Step1: Initialize camera.
Step2: Capture the Image frame.
Step4: Convert the image from RGB to HSV.
Step5: Threshold the image for the required color.
Step6: Apply morphological operations to eliminate noise.
Step7: Check if object found flag is true which is set by color detection algorithm to find whether the desired color object is detected. Go to Step2 if the flag is false otherwise proceed to Step2.
Step8: Find contours of the detected object to extract the vertices of the detected object.
Step9: If the vertices are equal to 3 or 4, a triangle or a square is found respectively.
Step10: Continue scanning go to step2.
Flowchart for Shape detection
Morphological Operations
Filtering is an important part of computer vision. In most of the applications, filtering should be applied to the images before processing on them. In our project, we applied morphological operations to remove noise and to do proper segmentation of the images. The two morphological operations we performed were: Dilation and Erosion.
Dilation: Dilation increases the white pixels along the boundaries of the foreground object. Consider the following example.
As we can see that dilation increases white pixels along the boundary of the image.
Erosion: Erosion is opposite to dilation. It increases the dark pixels along the boundaries of the foreground object. The example of the erosion is as shown in the figure.
As we can clearly see the erosion operation increased the black pixels along the boundary of the image. In our project, we applied erosion followed by dilation because the erosion sinks our object, so we dilate it.
Implementation
This section includes implementation, but again, not the details, just the high level. For example, you can list the steps it takes to communicate over a sensor, or the steps needed to write a page of memory onto SPI Flash. You can include sub-sections for each of your component implementation.
Testing & Technical Challenges
Describe the challenges of your project. What advise would you give yourself or someone else if your project can be started from scratch again? Make a smooth transition to testing section and described what it took to test your project.
Include sub-sections that list out a problem and solution, such as:
My Issue #1
Installing OpenCV on ARM 11
Using a pre-built conveyor system
Lighting was image processing
Conclusion
Conclude your project here. You can recap your testing and problems. You should address the "so what" part here to indicate what you ultimately learnt from this project. How has this project increased your knowledge?
Project Video
Upload a video of your project and post the link here.
Project Source Code
References
Acknowledgement
Any acknowledgement that you may wish to provide can be included here.
References Used
List any references used in project.
Appendix
You can list the references you used.
