S16: Mars 1
Contents
Project Title
Spread Spectrum Audio Visualizer
Abstract
The main goal is to design a LED display system to visualize audio frequency spectrum. The system we designed is capable of displaying audio frequencies up to 4 kHz as we have taken 8*8 LED Matrix to display.The audio is sampled through an audio amplifier with 50dB. The signals will be converted by integrated ADC module in the LPC1578 micro controller. The FFT algorithm is implemented to convert the value from time domain to frequency domain.Extracted frequency samples are manipulated to get power spectrum and will be given to LED matrix display through I2C interface. The LED matrix display will light up horizontal(row) and vertical(column) LEDs depending on the spectral component present in it.LED Matrix X-axis (rows) correspond to frequency and Y-axis (columns) correspond to power of that frequency, taken as the complex square root of the real and imaginary parts.
Objectives & Introduction
The main objective of the project is to convert audio analog signal from time domain to frequency domain and display the frequency and amplitude using LED matrix.
- 1. The control unit is using LPC1578 SJOne board which perform the Fast Fourier Transform(FFT). It takes input from audio module and uses ADC to convert to digital signals as input of FFT module, it uses I2C bus to write LED matrix board to display.
- 2. The audio input module is Adafruit Electric Microphone Amplifier - MAX9814 with Auto Gain Control; If takes sound/audio as input and filter the noise and pass the analog signal to SJOne board.
- 3. The 8x8 LED matrix is Adafruit Bicolor LED Square Pixel Matrix with I2C Backpack.There is I2C slave chip on board so SJOne board can write the registers to light up the LED to indicate frequency and amplitude.
Team Members & Responsibilities
- Jaswanth Bhimanapalli
- Fast Fourier Transforms(FFT) + I2C + Debugging ADC,LED Matrix issues +Video demo preparation +Testing
- Sucharitha Sirigireddy
- Fast Fourier Transforms(FFT) + I2C + Debugging ADC,LED Matrix issues +Video demo preparation +Testing + writing report and proposal review +Power point presentation
- Tianran Chen
- LED interfacing +Power point presentation
- Wei Liu
- ADC interfacing + Wikipedia update + Project proposal
Schedule
Show a simple table or figures that show your scheduled as planned before you started working on the project. Then in another table column, write down the actual schedule so that readers can see the planned vs. actual goals. The point of the schedule is for readers to assess how to pace themselves if they are doing a similar project.
| Week# | Start Date | End Date | Task | Status | Actual Completion Date |
|---|---|---|---|---|---|
| 1 | 03/07/2016 | 03/13/2016 | Submitted project proposal | Completed | 03/13/2016 |
| 2 | 03/14/2016 | 03/20/2016 | Research on system block diagram | Completed | 03/20/2016 |
| 3 | 03/21/2016 | 03/27/2016 | Study and Design led display of audio spectrum | Completed | 03/27/2016 |
| 4 | 03/28/2016 | 04/03/2016 | Parts Purchase | Completed | 04/06/2016 |
| 5 | 04/04/2016 | 04/10/2016 | Develop program for ADC driver | Completed | 04/18/2016 |
| 6 | 04/11/2016 | 04/17/2016 | Create task for buffering audio spectrum | Completed | 04/18/2016 |
| 7 | 04/18/2016 | 04/24/2016 | Finish coding and simulate software code; | Completed | 04/28/2016 |
| 8 | 04/25/2016 | 05/01/2016 | Initial bring up hardware board | Completed | 05/01/2016 |
| 9 | 05/02/2016 | 05/08/2016 | Initial Testing and debug and fix all hardware issues | Completed | 05/12/2016 |
| 10 | 05/09/2016 | 05/15/2016 | Final Testing and debug and fix all software issues | Completed | 05/17/2016 |
| 11 | 05/16/2016 | 05/22/2016 | Final Wiki report, Powerpoint, recording video | Completed | 05/22/2016 |
| 12 | 05/24/2016 | 05/24/2016 | Final Demo Day | Completed | 05/24/2016 |
Parts List & Cost
| Component Name | Quantity | Cost per Item | Total Cost |
|---|---|---|---|
| Audio Amplifier Board | 1 | $7.95 | $7.95 |
| LPC1758 SJOne Board | 1 | $80 | $80 |
| LED Matrix (8 X 8) | 1 | $15.95 | $15.95 |
| Wires | 6 | $0.1 | $0.6 |
| Total | $104.5 |
Design & Implementation
The design section can go over your hardware and software design. Organize this section using sub-sections that go over your design and implementation.
Hardware Design
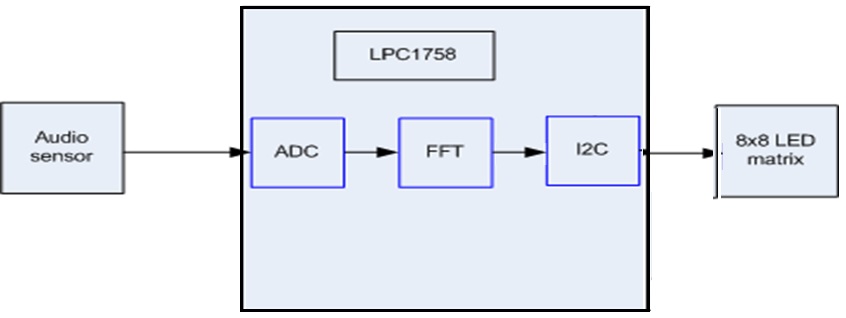
The hardware system is composed of audio board with sensor and filters, SJOne board based on LPC1758, LED matrix board. The block diagram is shown in below.

1. Audio Sensor Board:
The audio board is Adafruit AGC Electret Microphone Amplifier - MAX9814 as shown below:

The major parameters of the audio sensor board used in this project are:
- Supply Voltage: 3.3V @ 3mA current
- Output: 2Vpp on 1.25V bias
- Frequency Response: 20Hz - 20 KHz
- Programmable Attack and Release Ratio
- Automatic gain:40dB
2. SJOne Board:
The SJOne board is using NXP LPC1758 microcontroller. The top view of the board is shown below:
File:SJOne board.png
3. 8x8 LED Matrix Board: The led Matrix board is Adafruit Bicolor LED Square Pixel Matrix with I2C Backpack

Hardware Interface
As shown in the block diagram, the system is composed with 3 boards.

The wiring of the system is shown in below Figure.

For the audio sensor board,there are 3 pins connected to SJOne board:
- 1. GND connects to the X2 pin16(GND) in SJOne board;
- 2. VDD connects to the X2 pin17(VDD) in SJOne board.
- 3. Leave the Gain pin open to have gain as 60dB.
- 4. Connect the OUT pin to X1 pin 12(AD0.3) in SJOne board.
For the 8x8 LED matrix board, there are only 3 pins connected to SJOne board.Thanks to the “smarts” of the LED matrix backpack, this whole project requires fewer than a dozen parallel connections total:
- 1. Connect the LED matrix + pin to the SJOne Diode D1 cathord side as 5V to power up the LED board.
- 2. Connect the LED matrix – pin to X1 pin 1(GND) in SJOne board.
- 3. Connect the matrix backpack D (data) to X2 Pin 1(SDA1) in SJOne board and C (clock) pin to X2 pin 2(SCL1) in SJOne board, respectively.
Inside the SJOne board, ADC(Port 0.26)is used to sample the analog signals from audio sensor board. The converted digital signals will be 12 bits and they are passed to FFT module, after the FFT is calculated, the new values will be decoded by ARM controller and the controller will use I2C to write the registers in the LED matrix to light up the LEDs.
Software Design
Figure:Software flow diagram

Testing & Technical Challenges
Each module is tested manually as modules are small.Follwed boundary checks verification. Incremental integration is done.Initially FFT and ADC are integrated,then FFT LED Matrix areintegrated. Finally all three modules are integrated.
Testing and issues observed in ADC:
1.ADC was not working,as watchdog was resetting,we were using timer0/timer 1 for generating interrupt. As they were already used by other peripherals on the SJ board board was rebooting periodically.
2.Switched to timer 3 and channel 3 on ADC ,but this time we were not sure whether samples were over written, so increased queue size to store the samples.
3.Without the presence of amplifier ADC generating samples due to noise,so we realized that we need a filter. Presently we are not using any filter.
4.Our semaphore initialization was done globally,later we eliminated to limit the globla variables.
5.Taken different test tones and checked whether generated output is within the range or not.
Testing and difficulties faced in FFT:
1.It had taken long time to understand FFT calculation and to get the frequencies.
2.Standard libraries are taken for Cooley-Tuky implementation of FFT algorithm
3.Input given to test FFT when ADC module was not present is 0 to 4096 as these are the range of values generated by ADC.
4.We were able to test number of samples to FFT as 128 ,beyond that the values are crossing stack size and watchdog reset.
Testing and challenges observed in LED MAtrix:
1.The data sheet was little confusing.
2.After reading many times understood that initialization and data writing need to be done in a particular sequence.
3.It has taken time to understand writing to each row and column.Followed trial and error method.
4.There is no provision to switch off all rows and columns simultaneously,except for display off and on. Written a separate function to call when required to switch off all LEDs together.
Integration testing:
1.ADC output is given to FFT and result from adc is collected for further processing. observed from the print statements, which has printed all zeros as it was going beyond the limit. Changed type of input to double.
2.Had to refer different implementations to find the solutions how to to fit the display space to represent different frequencies and magnitude.So divided each row to represent magnitude from 0 to 4096 with interval of 512 and column to represent 0 Hz to wk Hz with 500 Hz interval.
3.And a range of frequencies are summed to form a bin for representation purpose.
4.Tested with input frequencies from 20 Hz to 4KHz. For each frequency at approximately same frequency band LEDs are glowing.
Conclusion
Following are our learning outcomes from the project:
1.We have learned how to write ADC driver.
2.Use 3rd party software,modify for our needs and integrate.
3.How to use Queues and Semaphores for synchronization and communication.
4.Judging which tasks to have what priority
5.Writing any driver from the technical documentation from the manufacturer.
6.Specific to project,we have learned audio frequency ranges,different FFT implementations,LED interface and how LEDs are organized to glow particular pattern
Project Video
S16: Mars 1--Spread Spectrum Audio Visualizer Video Demo
CMPE 244 Final Project Testing
Project Source Code
PowerPoint Presentation:
References
Acknowledgement
We would like to thank Preet for quick review our of ADC code and his guidance in all the stages of the project.
References Used
https://en.wikipedia.org/wiki/Fast_Fourier_transform
https://learn.adafruit.com/fft-fun-with-fourier-transforms/spectrum-analyzer
https://en.wikipedia.org/wiki/Spectrum_analyzer
http://plasticity.szynalski.com/tone-generator.htm
http://www.relisoft.com/science/physics/fft.html
Appendix
You can list the references you used.